


Before I go into the meat of this week’s newsletter, a revisit to the cycle studies of the markets, I wanted to give some attention to this newly minted fear of AI taking over the world and eventually eliminating mankind. First of all, this is really quite absurd, but if pounded on enough, and enough different “really smart people” expound upon it, it will eventually develop a level of following. I for one don’t do anything but shake my head at the comments. First off, if two of the largest AI developers in existence, OpenAI & Anthropic today (I say today as they could become irrelevant in a matter of months if a better mousetrap emerges) are the ones that are saying to slowdown the development of AI, I have to challenge their integrity in their comment simply by recognizing that they are the ones the created the problem that they are stating. Therefore, shame on them for not doing everything in their power to protect the world from what they are the creators of.
Last weekend’s press gave much attention to this issue, but there were a couple articles that I felt deserved attention and then I will follow with what Mr. Market is saying in the way of US equity market price moves. In a seldom seen section in the incredibly liberal and Trump hating NY Times Opinion section, there was an interview with the pioneer of the current AI industry, Jensen Huang. The columnist, Ezra Klein tries numerous times to suck Huang into this hysteria, but Huang eloquently sidesteps this fallacy and makes what I felt were really clear and non-emotional observations. Klein asks Jensen just what kind of technology are we dealing with here. He states simply “technology.” Klein then brings up the issue of the need to slow down development. In reference to the two AI leaders who are discussing slowing down advancement Huang says, “But they can’t slow down. Nobody is building more compute today than the people asking to be slowed down. It strikes me as odd. I know a lot of people in those two labs who are dedicating their lives to do good work. They know what happened. I know they know what happened. I know they know how to fix it, and I know they’re fixing it.”
In Barron’s there was the article, “Don’t Worry- Chances Are AI Won’t Take Your Job.” this has been another false fear. Even before artificial intelligence threatened to destroy humanity, it was poised to wipe out the workforce, or so it was feared. But these dark prognostications fail to recognize that technological revolutions don’t occur in vacuums. Factors like physical infrastructure, demographics, and the pace of implementation arguably matter more for the labor market and broader economic outcomes than any individual, technological advance. Emerging data show that companies leveraging AI the most are implementing fewer layoffs, not more. According to the World Economic Forum, 92 million jobs are forecasted to be lost by 2030, but 170 million new jobs will be created as a result!
John Cochrane, a prominent economist and senior fellow at the Hoover institution last Stanford University, says we should, “stop worrying about the jobapocalypse. What happens when we get a cost-saving technology is that it expands output so much and new businesses expand so much that there are more jobs and everybody is better off.”
This then brings me to this last week and the almost historic rise in interest rates that was forecasted to surely be the demise of US stock prices. The market action this past week was notable in that even with Treasury Yields spiking to new highs heading right into the end of the week, it has not resulted in a massive stock wipeout. The 10-Year Treasury Yield ($TNX) and the 30-Year Treasury Yield ($TYX) both posted new multi-decade highs on Friday before stalling slightly after rising for four days in a row. Higher long Treasury yields have not sparked a migration out of stocks and into Treasuries. While much is made of higher rates being due to a hawkish Fed amid persistent inflation, consider that it may simply be due to the fact that, with over $40 trillion in national debt and an annual interest bill of $1.4 trillion for that debt, investors are just dumping Treasuries to reduce credit-risk exposure. This could of course be true, but I really believe that it is more a result of the incredible and immediate effect of AI on all industries. Barron’s title article was a healthcare roundtable of numerous analysts talking about biotech advances in medicine and how stocks are beginning to reflect these advancements. In the last paragraph of the article one of the analysts even says, “I’m surprised there was no mention of the effects of AI on the pharmaceutical industry.” Times, they are a changin’.
Monday of last week the buying was steady throughout the session, with practically no meaningful pullbacks along the way. This followed Friday’s action which I found no comments on in any market analysis, although it was very telling. Friday, September 19th was the end of a very sloppy week where the Fed raised interest rates. In the last 15 minutes of the trading day the market went almost vertical. This was followed by Monday’s very broad up move. According to famed technical analyst Tom McClellan, that kind of action suggests heavy institutional buying:
“Smooth intraday trends typically happen when there is a large amount of money that needs to get put to work, but the big firms don’t want to dump a large order into the market all at once and move prices. So their trading desks use algorithms to chop up the large slug of money into smaller pieces, doling orders out more slowly. This results in that linear form of the intraday chart plot. The key takeaway, therefore, is that there must be a large amount of money deciding to move now, based on seeing footprints in the intraday plot which match the behavior of prices when that condition is in effect.” — Tom McClellan
Based on what led the way Monday, it seems clear that much of that capital was flowing back into mega-cap tech, AI, and the semiconductors. While most still seem to be talking about an AI bubble, it is worth remembering that these stocks have done practically nothing for months, and the Magnificent 7 have lagged for over a year now. That recharging period makes it more likely this bounce can have some legs — even if I continue to believe it will be difficult to push the S&P 500 much above 8000 in the near term.
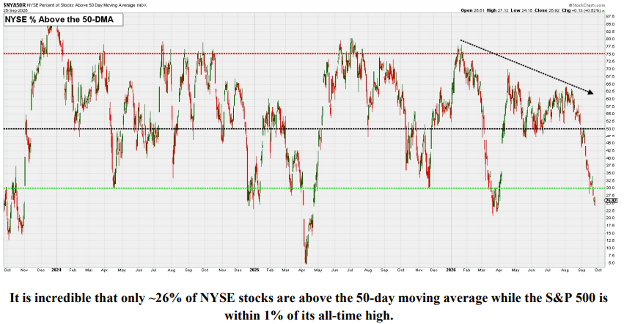
In looking at the whole market, a totally different picture is clear. We are now at extremes of oversold in the overall market the likes of which were only seen in late March of this year and the ultimate lows last year:
Defying gravity
If, on January 1, you were told that by late September the Strait of Hormuz has been closed for six months and counting, the Fed has pivoted from making rate cuts to its first hike in three years, the 10-year yield climbed above 5% for the first time since 2007, and AI had been rumored to annihilate both software earnings and the human race, where would you put the S&P 500? My guess is that most would have taken the under at 7765, up 13.4%, with a max drawdown of 9.1% on a closing basis. Yet here we are.
The S&P 500 has been choppy since its May 14th and into the August 13 record high, but we would characterize the last few months as sideways rather than a downtrend. How has it managed to defy gravity?
First, earnings have been much stronger than expected. S&P 500 operating earnings soared 32.1% in the second quarter and are expected to rise 25.6% for the calendar year 2026. The S&P 500 forward P/E ratio is down three points year-to-date, suggesting investors have pushed prices higher while maintaining some skepticism about whether those numbers are repeatable. This is truly an anomaly as prices tend to rise faster than underlying valuations implying that as prices rise companies are getting more expensive, but this is not the case now. Here is the picture:
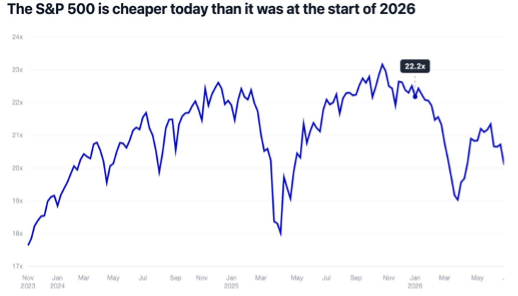
To me, what is most characteristic of the year 2026 is the tug-o-war that prices of indexes and sectors have been. Yet valuations have not only remained very contained but have actually gotten cheaper. The US stock market as illustrated by the S&P 500 has gone up over 13% yet the companies, based on prices relative to earnings, have decreased almost 3%. This is very very uncommon. I also believe that this is the reason why the seasonal declines that I have been warning about have not manifested in any significant way. In looking at the cycle composite of the market since 1928, it is seen below in blue that from August highs, markets decline into about the 10th of October and then put in their normal year-end rally. This year, I’ve circled the action of August through September, the markets have actually not only gone sideways but are poking their heads out to all-time highs:
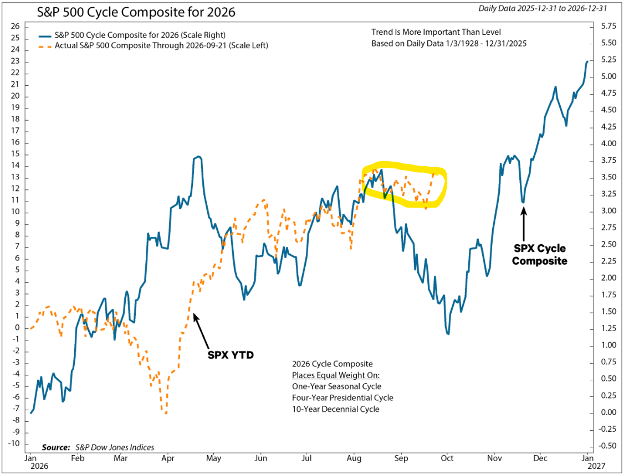
This has been due to the action of the Magnificent 7 companies that are overweight in the index and the overall technology sector due to the historic profitability due to the implementation of AI across all companies globally. The bottom line is that weaker performance under the surface is the type of technical divergence common around market tops. Hence, the equal weighted S&P shows a totally different picture than the capitalization weighted S&P which the world uses as its measure of the US Equity market. Our base case continues to be a year-end rally, but model improvement will be needed in more companies than just technology for the year-end to be the party that is normally expected.
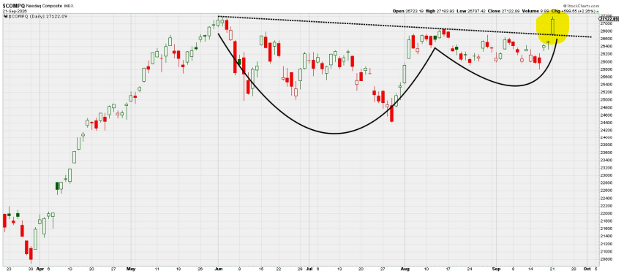
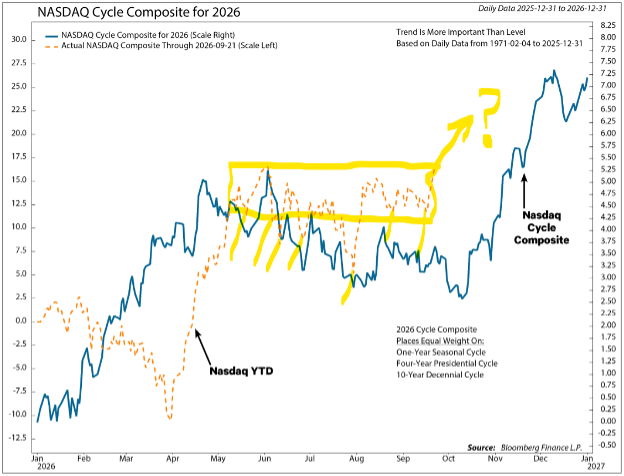
To single out the growthier technology group, I took the time to do the same Cycle Composite study of the NASDAQ which is not inclusive of the slower growing companies that populate the S&P 500. Here is what this composite looks like. Again, I have circled the action of this year, but instead of just the August-September period being focused upon, I want to make sure that proper recognition of the time period going back to late May is used. This has really remained in a frustrating “box” kind of formation with sharp moves down that make the market look like it is going to go into a substantial decline, and then frustratingly climbing back up to the highs. This level was eclipsed this last week. Does that mean the digestion period is over? Time will tell, but the facts will rely on earnings and forward earnings projections for the third quarter. Here is the chart with the period just referenced highlighted:
Given the composition of the Dow Jones Industrial average or the “DOW” as it is commonly known, it is clear that this index is far less tech-centric and therefore is following normal seasonal cycle trends more consistently:
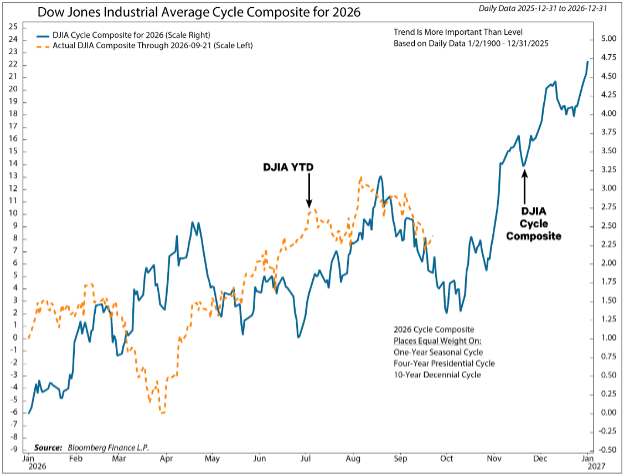
This then begs the question, if the DOW more closely represents the non-tech companies, and it does its normal bounce after the beginning of October, could this provide additional catalyst to an already robust NASDAQ tech-centric basket that could propel the larger S&P 500 to a significant run into year-end? Only time will tell, but if AI really can do much of what has been promised, this could actually be the case.
Bottom line
Market-cap-weighted popular averages have defied seasonal weakness that tends to last into early October, so far. The average stock has not. The result is a troublesome technical divergence that has been picked up by my analysis. Since our macro indicators (broad economy and individual earnings progression) have shown few signs of weakness, and sentiment has remained overly pessimistic, we are giving the market a chance to work through the divergences. A year-end rally remains our base case, but if the divergences do not clear up as the market exits its seasonally weak period, we might not only fail to see the infamous Santa Claus rally but might also see some lumps of coal that I for one don’t want under my Christmas tree.
U.S. PMIs show economic growth strengthening 9.23.26 (reason why mkt got cracked and 10-yr spiked)
The S&P Global flash U.S. composite PMI jumped 2.4 points in September, up for the fourth consecutive month, to 58.4. This was its highest level since July 2021, indicating that business activity has strengthened substantially in Q3. It creates a favorable macro backdrop for equities, as the S&P 500 index has historically posted above-average gains when the three-month change in the composite PMI has been positive.
It was led by strong domestic demand, as export orders remained largely depressed. The surge in demand put a strain on existing capacity, with backlogs jumping at the sharpest rate also since early 2022. This encouraged more hiring in both services and manufacturing. Notably, the employment index in manufacturing climbed to its highest level since February 2021. Separately, the Philly Fed state coincident indexes show U.S. economic growth remains widespread geographically. In August, 46 states expanded, two were unchanged, and only two contracted.
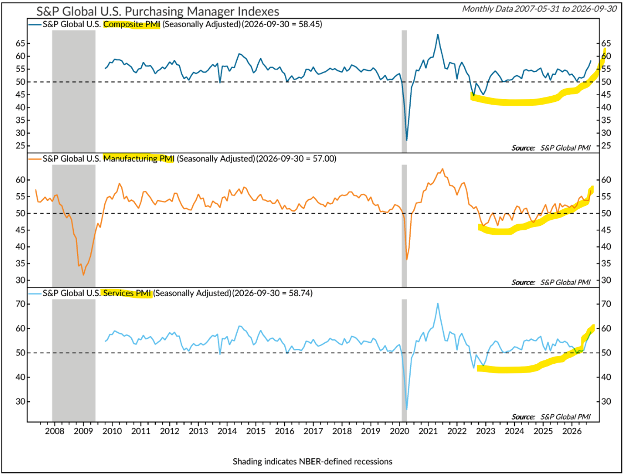
The economics have been strong, and the forecasts are for continued strength. At some point this level of strength will have to taper off. When it does, this could be the ultimate reason for a more substantial pullback. But as I write this, the tug-o-war continues, with technology leading the indexes and pulling them higher and the rest of the market as illustrated by the DOW above trying to pull stocks lower. Who wins? I guess we will have a clearer answer after the Midterms in five weeks and the third quarter earnings which will begin in October.
-Ken South, Tower 68 Financial Advisors, Newport Beach
Important Disclosures:
The opinions voiced in this material are for general information only and are not intended to provide specific advice or recommendations for any individual. To determine which investment(s) may be appropriate for you, consult your financial professional prior to investing. All performance referenced is historical and is no guarantee of future results. All indices are unmanaged and cannot be invested into directly.
Investing involves risks including possible loss of principal. No strategy assures success or protects against loss. There is no guarantee that a diversified portfolio will enhance overall returns or outperform a non-diversified portfolio. Diversification does not protect against market risk.
The Standard & Poor's 500 Index is a capitalization weighted index of 500 stocks designed to measure performance of the broad domestic economy through changes in the aggregate market value of 500 stocks representing all major industries. The S&P 500 is a stock market index tracking the stock performance of 500 of the largest companies listed on stock exchanges in the United States. Indexes are unmanaged and cannot be invested in directly.
The Dow Jones Industrial Average is comprised of 30 stocks that are major factors in their industries and widely held by individuals and institutional investors.
The Nasdaq-100 is a large-cap growth index. It includes 100 of the largest domestic and international non-financial companies listed on the Nasdaq Stock Market based on market capitalization.
The NASDAQ Composite Index measures all NASDAQ domestic and non-U.S. based common stocks listed on The NASDAQ Stock Market. The market value, the last sale price multiplied by total shares outstanding, is calculated throughout the trading day, and is related to the total value of the Index. Indexes are unmanaged and cannot be invested in directly.
The Russell 2000 Index is an unmanaged index generally representative of the 2,000 smallest companies in the Russell 3000 index, which represents approximately 10% of the total market capitalization of the Russell 3000 Index.
Data sourced from Bloomberg (2025).
Stock investing includes risks, including fluctuating prices and loss of principal. No strategy assures success or protects against loss. There is no guarantee that a diversified portfolio will enhance overall returns or outperform a non-diversified portfolio. Diversification does not protect against market risk.
Bonds are subject to market and interest rate risk if sold prior to maturity. Bond values will decline as interest rates rise. Bonds are subject to availability, change in price, call features and credit risk.
Government bonds are guaranteed by the US government as to the timely payment of principal and interest and, if held to maturity, offer a fixed rate of return and fixed principal value.
Bond yields are subject to change. Certain call or special redemption features may exist which could impact yield.
International investing involves special risks such as currency fluctuation and political instability and may not be suitable for all investors.
Alternative investments may not be suitable for all investors and should be considered as an investment for the risk capital portion of the investor’s portfolio. The strategies employed in the management of alternative investments may accelerate the velocity of potential losses.
This information is not intended to be a substitute for specific individualized tax advice. We suggest that you discuss your specific tax issues with a qualified tax advisor.
The economic forecasts set forth in this material may not develop as predicted and there can be no guarantee that strategies promoted will be successful.
The financial professionals with Tower 68 Financial Advisors are registered with, and securities and advisory services are offered through LPL Financial, a registered investment advisor. Member FINRA/SIPC.
LPL Tracking # 1183397